7. Preferences#
7.1. Stream data display preferences#
Stream data can be displayed in different units of measure. As an example, here we show a stream’s flow in kg/hr, temperature in Celcius, and pressure in bar:
[1]:
from biorefineries import sugarcane as sc
import biosteam as bst
bst.nbtutorial() # Light-mode html diagrams, filter warnings, and reset preferences
sc.sugarcane.show(
    flow='kg/hr', T='degC', P='bar', # Change units of measure
    composition=True, # Show as fractions
    N=100, # Total number of components to show
)
Stream: sugarcane to <ConveyingBelt: U101>
phase: 'l', T: 25 degC, P: 1.01325 bar
composition (%): Water          70
                 Glucose        1.21
                 Sucrose        13.7
                 Ash            0.6
                 Cellulose      6.12
                 Hemicellulose  3.61
                 Lignin         3.28
                 Solids         1.5
                 -------------  3.33e+05 kg/hr
We can make this the default through the preferences object:
[2]:
import biosteam as bst
bst.preferences.update(flow='kg/hr', T='degC', P='bar', N=100, composition=True)
sc.sugarcane.show() # Notice how the default style has been updated
Stream: sugarcane to <ConveyingBelt: U101>
phase: 'l', T: 25 degC, P: 1.01325 bar
composition (%): Water          70
                 Glucose        1.21
                 Sucrose        13.7
                 Ash            0.6
                 Cellulose      6.12
                 Hemicellulose  3.61
                 Lignin         3.28
                 Solids         1.5
                 -------------  3.33e+05 kg/hr
We can save preferences to not have to update it in later sessions (it will autoload when you restart Python):
[3]:
# bst.preferences.save()
We can also reset all preferences back to the default:
[4]:
bst.preferences.reset()
sc.sugarcane.show() # Notice how the default style has been reset
Stream: sugarcane to <ConveyingBelt: U101>
phase: 'l', T: 298.15 K, P: 101325 Pa
flow (kmol/hr): Water          1.3e+04
                Glucose        22.4
                Sucrose        133
                Ash            2e+03
                Cellulose      126
                Hemicellulose  91
                Lignin         71.8
                ...            5e+03
7.2. Diagram display preferences#
To view full output in material flow rates and unit operation results in diagrams when you hover the mouse:
[5]:
# Running `prefrerences.reset()` set diagrams to
# "classic mode" which works for both light and dark backgrounds
bst.preferences.tooltips_full_results = True
bst.preferences.graphviz_format = 'html' # IMPORTANT: Full output only works with html format
sc.D302.diagram()
There are many options related to diagrams available in preferences, including the display background and stream colors. Feel free to make changes and save them too! Here are a few preselected display options that you might like:
[6]:
bst.preferences.light_mode()
sc.D302.diagram()
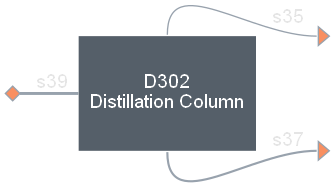
[7]:
bst.preferences.dark_mode() # Try toggling the tutorial sun/moon icon at the top right
# A bug in readthedocs requires png for correct background colors.
# If format is png, hovering the mouse on units/streams won't show results.
sc.D302.diagram(format='png')
# Alternatively, you can save the diagram as html and view the file separately
# in a dark background. For example:
# sc.D302.diagram(radius=1, file='diagram', format='html')
To prevent diagrams from being automatically displayed on the ipython console:
[8]:
bst.preferences.autodisplay = False
sc.D302 # Notice how the diagram was not displayed
BinaryDistillation: D302
ins...
[0] s34  from  HXprocess-H302
    phase: 'l', T: 374.04 K, P: 607950 Pa
    flow (kmol/hr): Water    1.01e+04
                    Ethanol  491
                    Glucose  8.1
                    H3PO4    0.364
                    Yeast    1.83
outs...
[0] distilled_beer  to  Mixer-M303
    phase: 'g', T: 386.16 K, P: 212782 Pa
    flow (kmol/hr): Water    1.26e+03
                    Ethanol  491
[1] s32  to  Pump-P302
    phase: 'l', T: 395.33 K, P: 212782 Pa
    flow (kmol/hr): Water    8.88e+03
                    Ethanol  0.0347
                    Glucose  8.1
                    H3PO4    0.364
                    Yeast    1.83
Don’t forget to save your preferences with bst.preferences.save()!